
If you want to get results less than a minute for large data and make quick report in less than a minute in MS Excel for analysis large data by few clicking, then you will find best method in this article. Large organizations often deal with massive amounts of data that need to be analyzed quickly to generate meaningful insights. Ms Excel has powerful tool which make report in less than a minute by a few clicks namely Subtotal option. A common example is calculating employee compensation by department, including both the total amount and the average compensation. Therefore MS Excel has got functionality that work quickly for calculation for this work.
What does Subtotal option do in simple way.
Subtotal option is used to calculate amounts, number and etc.. by grouping wise. For example, we want to know about how many employees are getting salaries in different departments. Then, this Subtotal option will perform action to show department wise salaries of employees.
Steps for organized Data:
1. First of all, sort out column which you want to get desired result
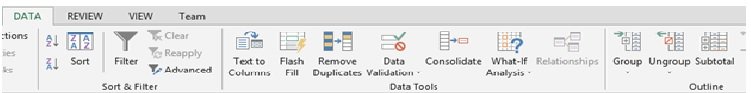
2. Then Goto DATA Tab and choose Subtotal.
3. In Subtotal, first option is At each change in which you select that columns which you sorted in first step.
4. Then in which function you want to use in your data select.
5. Lets go to practical.
1. First Step, Go to Data Tab
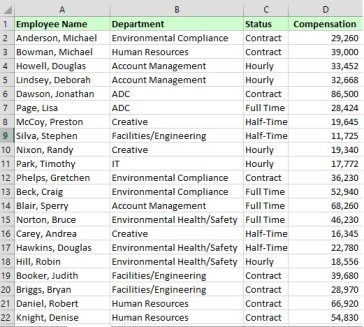
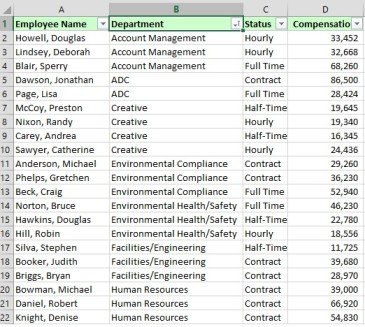
2. Second Step, Make Unsorted Data to Sorted Departments Wise
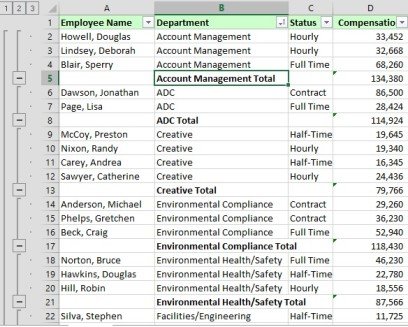
here is unsorted data department wise.
Here is Sorted Data department wise.
3. Third Step, Goto Data Tab, Select Subtotal Option from Group Outline
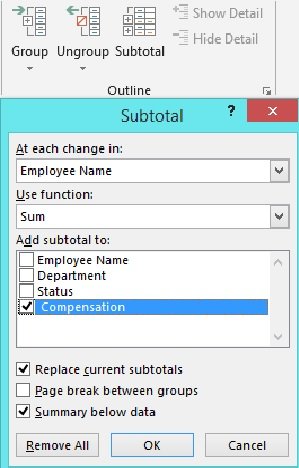
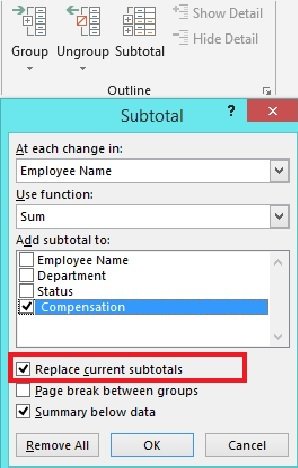
In this Subtotal dialogue box, you can see different options:
- 1. At each change in
- 2. Use functions
- 3. Add subtotal to
- 4. Replace current subtotal
- 5. Page break between groups
- 6. Summary below data
In At each Change in, you have to choose department, because we want to get results by department and therefore we sorted data department wise in our MS Excel Sheet.
In “Use function”, in this function you can use any function which you want to calculate, i.e. Sum, Average, Count, Max, Min and more….
And where is written, add Subtotal to:, you have to select options in checkboxes which columns want to calculate, if you want to get more one column calculations then you can select it, in this article example, i am using one column to calculate compensation Total, Max, Min, Count.
Now, after click on OK button, you can see MS Excel made quick report department wise and calculate total amount of compensation.
Further more, if you want to know how to calculate Minimum, Maximum, Average of compensation department wise, you have to uncheck this mark where is written [Replace current totals] and click again where is written [Use Function]. Now, you can select more functions for average, Max, Min.
After uncheck this option, you have to select every time for every new function to calculate, For example, after uncheck this option, i select function of Average and then i click on OK button. Then, i again select Subtotal option and select function of Max, Min respectively and click on OK button. you can see result in picture.
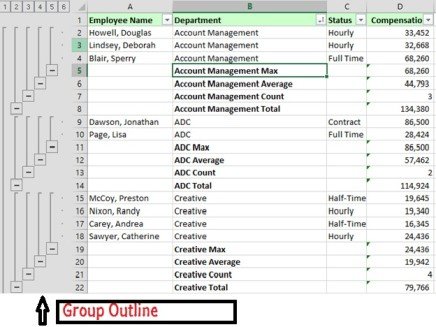
For Group outline, if you want to hide this Group Outlines, you have to press Ms Excel Shortcut key CTRL+8, and if you want to unhide or show again Group Outlines, you have to again press Ms Excel Short key.
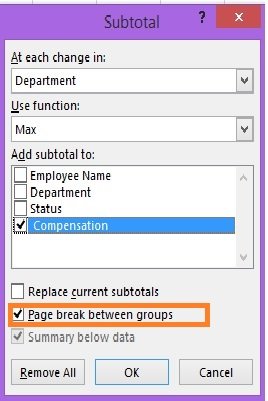
Further more, after making this report department wise compensation calculations, we want to print separately on one page for every department details. For achieve this target, you need not to take any tension, here is very simple solution , you just will have to click on Page break between Groups and then every department page will be broken and you can print each department wise report.
I hope, this article will help you for to make quick report in MS Excek for analysis Large Data by few Clicks. For your practice, i have attached MS Excel file.
If you want to learn through video, you can watch it.